When plastic prices go up at the grocery store or procurement for construction and manufacturing, it is easy to blame whatever big news story is dominating the headlines. Right now, a lot of public commentary and mainstream economic analysis points to the blockade in the Strait of Hormuz. The story we keep hearing is simple: foreign shipping lanes are blocked, global supply is choked off, and that is why the cost of everyday plastics and resins is skyrocketing here at home.
It sounds like common sense. But when you look at the actual data, nuances of global supply chains, and unique production in the U.S., this popular narrative completely falls apart.
While geopolitical tension is undoubtedly a factor in global volatility, a closer examination of the domestic market reveals a more complex driver of price inflation. For American manufacturers, the rising price of plastic resin, such as High-Density Polyethylene (HDPE), is not merely a symptom of blocked foreign straits.
This article will cover key background information about the U.S. production of plastics and how the U.S. plastics market is theoretically insulated from foreign market disruptions like the Iran Conflict.
Background: How does domestic production of plastics differ from global production?
The Center for International Environmental Law states: “Virtually all (over 99%) of plastics are produced from chemicals sourced from fossil fuel” (Natural Gas, Crude Oil, and Coal.)
These source materials are referred to as “feedstocks.”
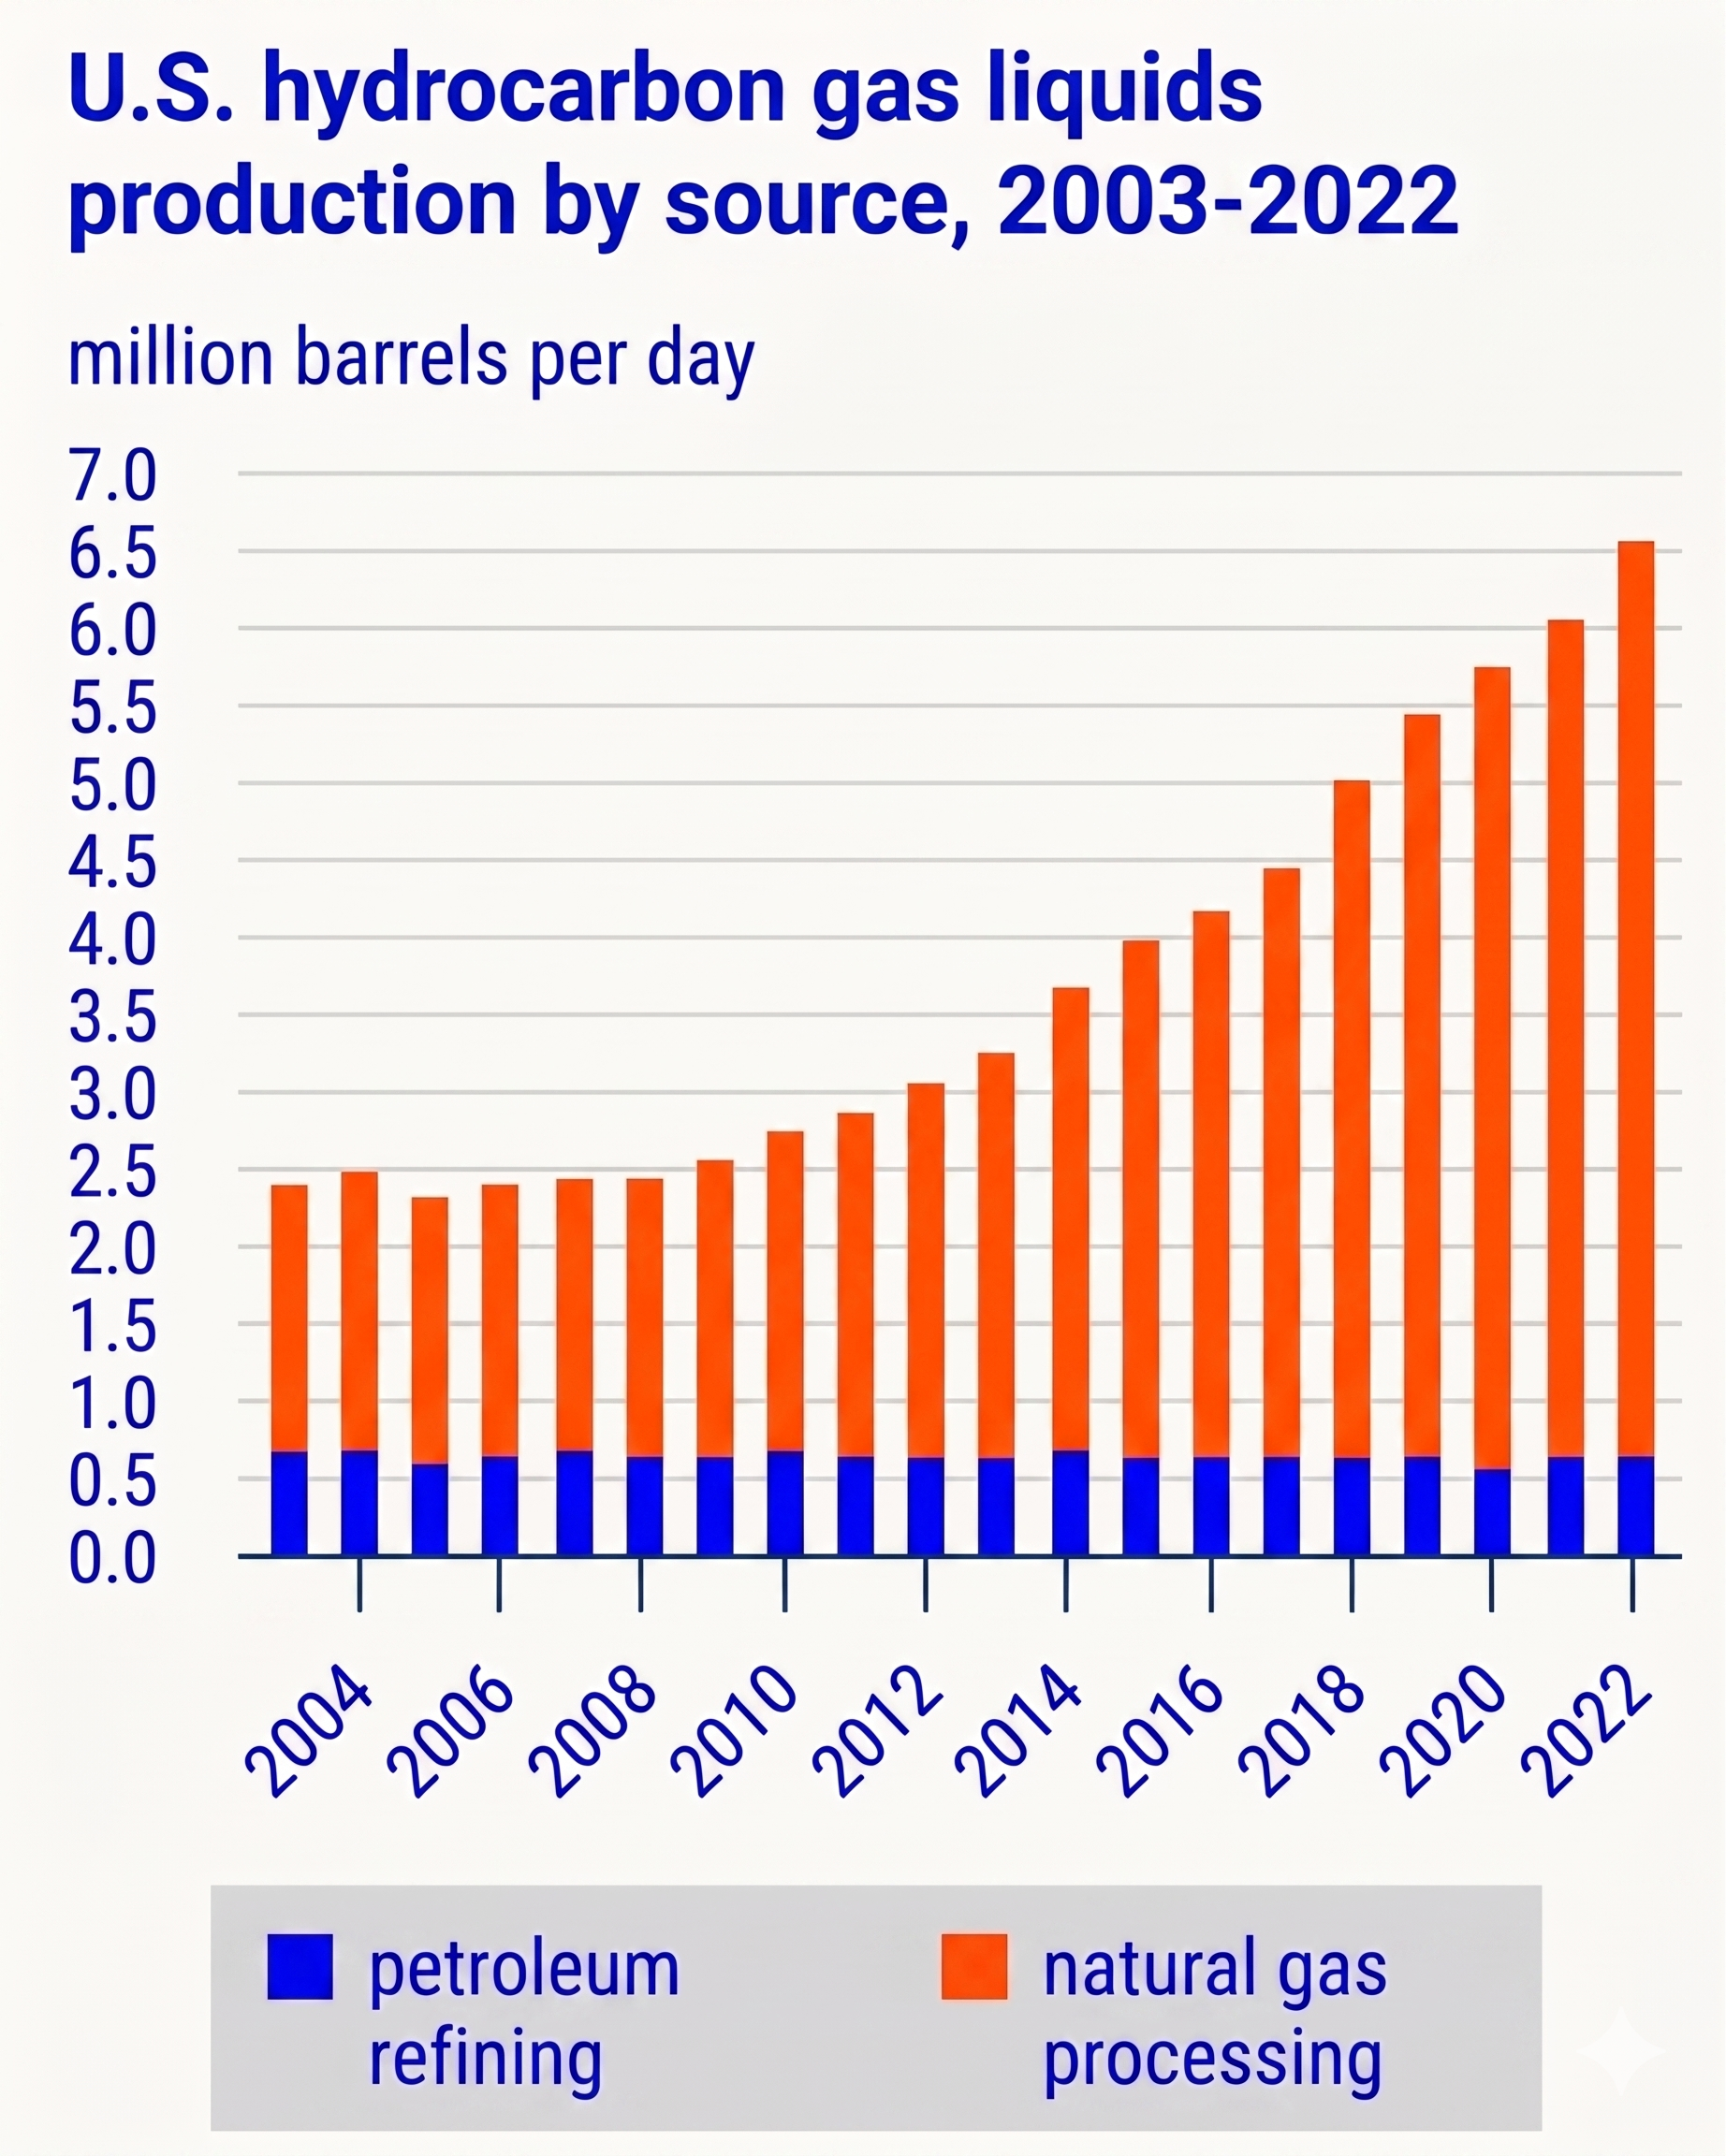
The U.S. Energy Information Administration explicitly states that it is “unable to determine the specific amounts or origin” of these feedstocks for producing plastic. Many of the raw materials used in plastics production, specifically hydrocarbon gas liquids (HGLs), are produced as byproducts of both natural gas processing and crude oil refining.
By tracking HGL production by feedstock, The EIA can conclude: “Most HGLs produced in the U.S. are byproducts of natural gas processing rather than oil refining” as seen in the adjacent graph.
Given this, the EIA is confident that “Although crude oil is a source of raw material (feedstock) for making plastics, it is not the major source of feedstock for plastics production in the United States.”
Additionally, due to the relatively lower cost of natural gas compared to crude oil in the U.S., it would be economically unviable to produce plastics with a crude oil feedstock. Through tracking feedstock for producing the key input for plastics like hydrocarbon gas liquids, the EIA is confident that natural gas is the primary driver in plastic production for the U.S. market.
However, the rest of the world primarily relies on coal and crude oil (petroleum) as plastics feedstocks.
According to Nature, around 98% of the global virgin plastics produced in 2022 is generated from fossil-fuel based feedstocks (44% derived from coal, 40% from petroleum, 8% from natural gas, 5% from coke and 1% from other sources)
Research from Nature finds: “The U.S. produced ~130 billion pounds of plastics in 2023, and global production was ~882 billion pounds.” The U.S. represents ~15% of global plastics production in 2023. Because the rest of the world relies almost exclusively on coal and petroleum, the U.S. represents the vast majority of global plastic production that is derived from natural gas.
This creates a clear disconnect in U.S. plastics production inputs and global inputs, which is one of the foundational reasons we are seeing a disconnect in plastic pricing as well as due to the unique nature of the U.S. natural gas market.
Background: Understanding the U.S. Natural Gas Market and Supply
According to the EIA: the United States has been the world’s largest producer of natural gas since 2009. In 2023, the United States produced 104 billion cubic feet per day (Bcf/d) of natural gas, 75% more than the world’s second-largest natural gas producer, Russia. Marketed natural gas production in the Lower 48 averaged 117.2 billion cubic feet per day (Bcf/d) in the first quarter of 2026, a 4% increase compared with the same period in 2025.
The United States is the world’s leading exporter of natural gas, selling 8.9 trillion cubic feet (Tcf) of natural gas to the rest of the world in 2025. Unlike the global oil market, however, the natural gas market is fragmented and costly to transport overseas. Intercontinental natural gas trade requires a capital-intensive liquefied natural gas (LNG) value chain that includes specialized liquefaction at the source and regasification at the destination. This creates high barriers to market integration and leads to large price differences across regions requiring this complex transportation.
The US is effectively producing more natural gas than it has infrastructure to export leading to large domestic supplies. Global demand for natural gas is rising, and the U.S. cannot physically export enough to meet that demand. This lack of export capacity actually insulates the U.S. from the large price shocks seen in global natural gas pricing.
This is evident by the large spread in domestic natural gas prices to global prices. European and Asian Prices are around $15-$17 per MMBtu of natural gas, while U.S. prices are at $2.8/MMBtu. Compared to a more fungible commodity like oil where the same spread is $92 for 1 West Texas Intermediate barrel as the U.S. benchmark, and $96 for Brent Oil as the global benchmark. This is a significant price spread between natural gas due to the export transportation and logistics infrastructure that other energy commodities like oil do not struggle as much with.
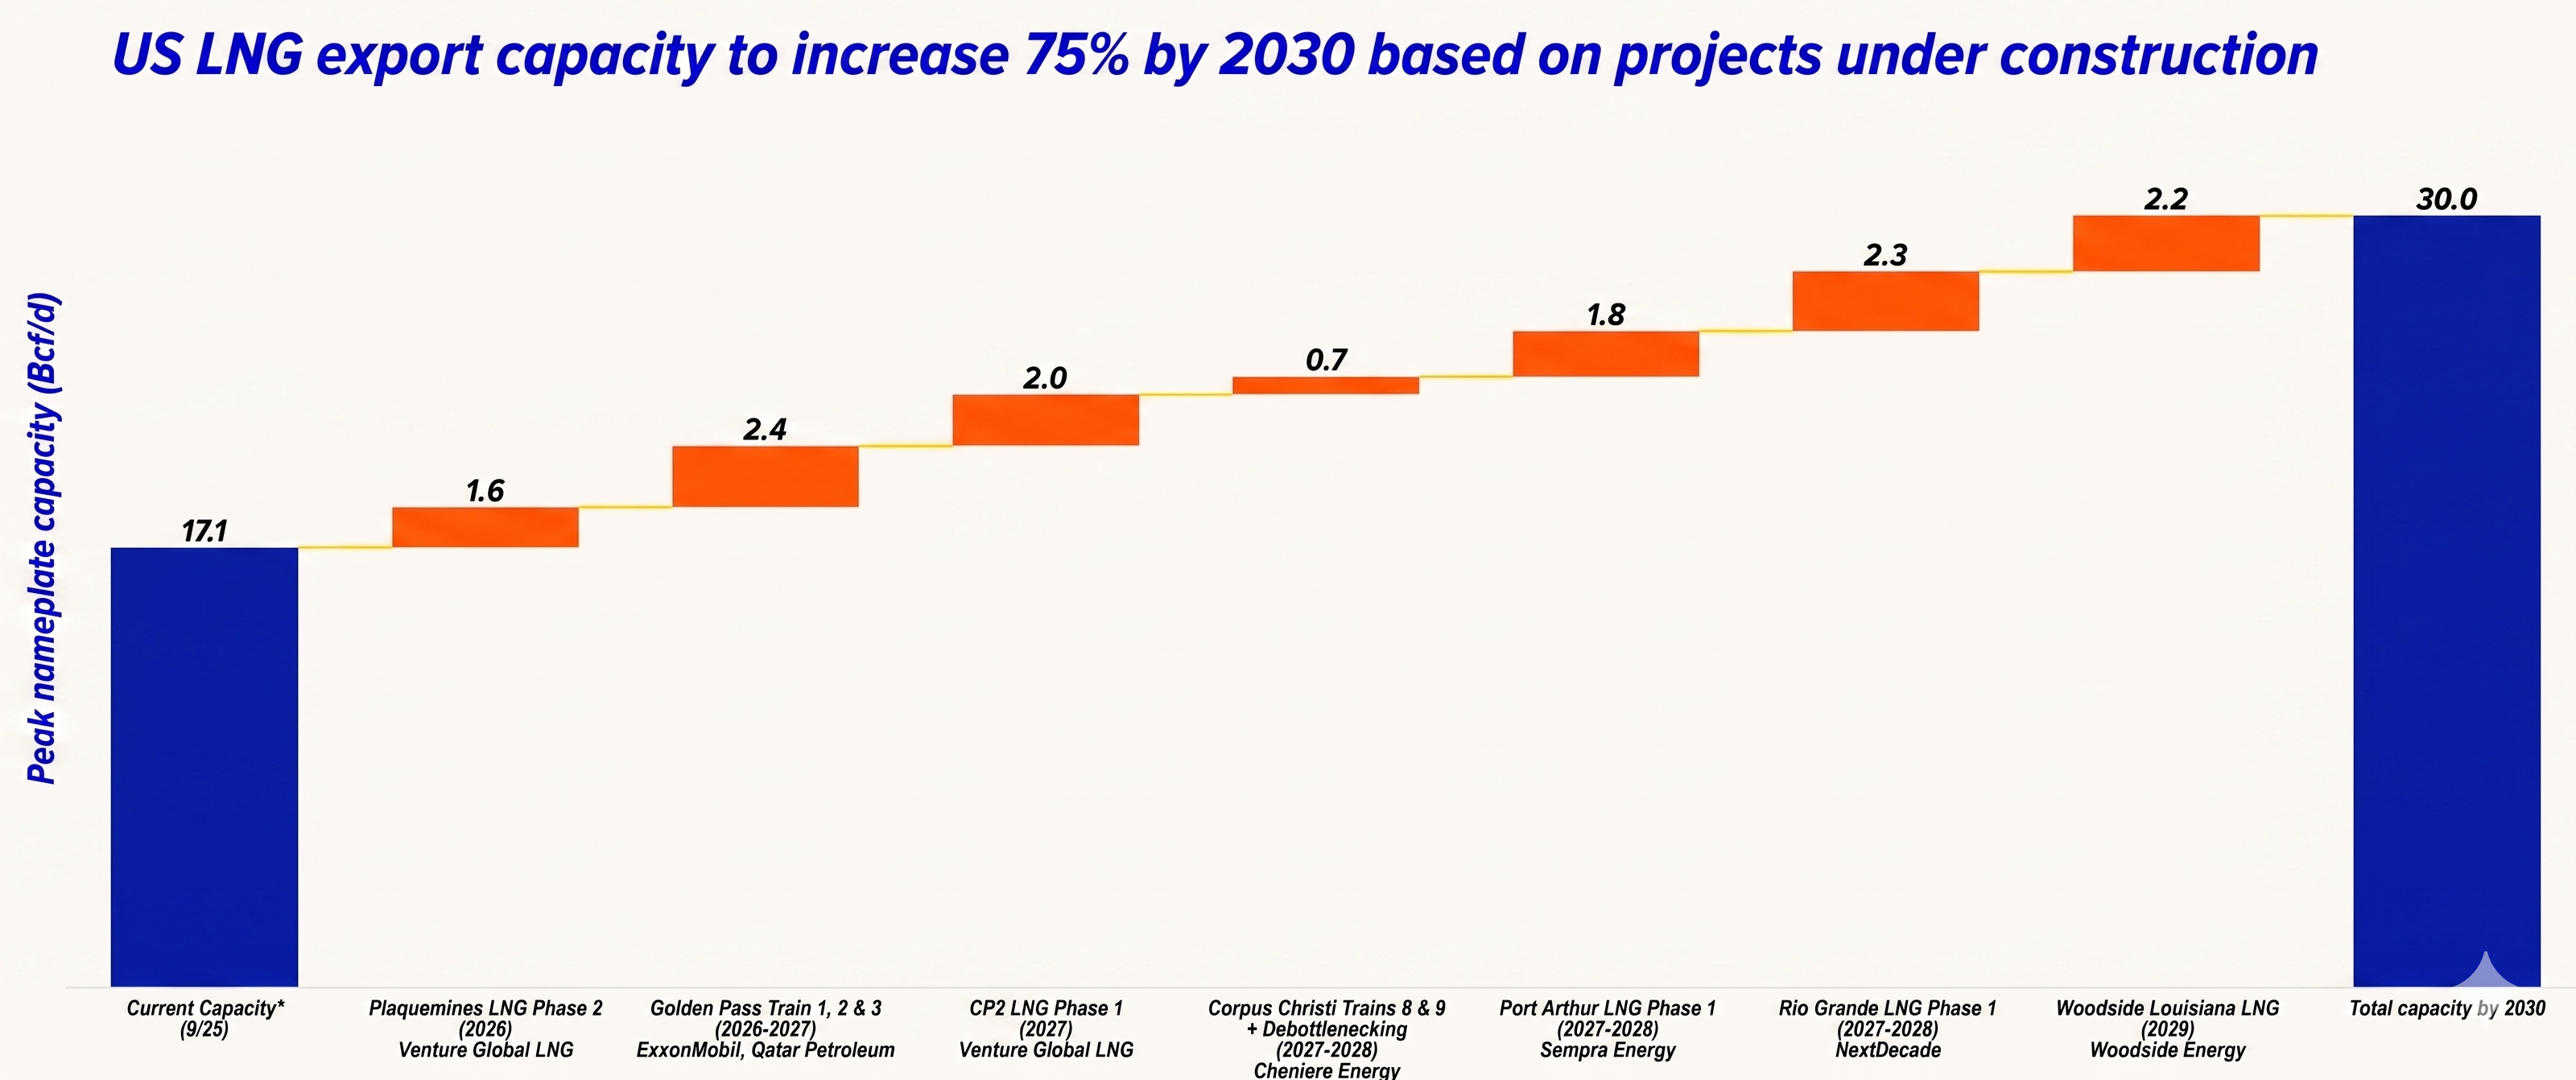
U.S. natural gas producers identified this price gap as a major opportunity for export profit, leading many companies to begin development of export infrastructure and analysts to project a large growth rate of export capacity in the coming years.
U.S. LNG (Liquified Natural Gas) export capacity is expected to increase 75% by 2030 based solely on current export terminal infrastructure projects under construction.
“Investment in liquified natural gas (LNG) is expected to increase more than 50% by 2029”, according to Goldman Sachs Research. Rapid supply-side infrastructure developments alongside export infrastructure will keep U.S. natural gas prices and plastic production costs relatively low as we see now.
The Energy Information Administration’s May 2026 Short Term Energy Outlook shows that natural gas storage is 7% above the five-year average. This signals an over-supply of feedstock that should lower plastic input prices and therefore plastics themselves.
Now connecting this trend to the current domestic plastics market.
Unlike the U.S. natural gas industry, export logistics and infrastructure for plastics is more developed, allowing plastics producers to realize the large spread in cheap domestic natural gas feedstock and expensive foreign feedstocks through exporting derivative products, like plastics, overseas where plastics are much more expensive to produce. Producers are effectively “exporting” our cheap natural gas in the form of plastic pellets to capture global margins.
Exxon explicitly noted in their Q1 2026 Earnings Call that as crude prices rise, their U.S. footprint becomes more profitable because they are “gas crackers” while the “world price is being set on liquid [naphtha] crackers.”
The story is not the same for companies operating outside of the U.S.
Many overseas plastics producers are struggling to manage the higher feedstock costs resulting in passing costs to consumers and raising prices of plastics. However, because U.S. plastics prices are based on fundamentally different feedstock production systems, U.S. plastics costs should not follow the same trend.
This is evident by the recent force majeure in foreign operations of multinational plastics companies like Formosa. Formosa issued a force majeure on March 10, 2026, with disruptions focused in the Chinese, Indian, and Southeast Asia operations, due to shipping disruptions in the Strait of Hormuz caused by the Iran war.
However, these delays are focused in markets outside of the U.S. where, again, feedstock pricing and sourcing for plastics production is fundamentally different. Multinational companies’ U.S. operations are healthier and not experiencing severe disruptions. This further bolsters the idea that the U.S. plastics market is in fact more insulated from the closure of the Strait of Hormuz than other countries given our unique feedstock surplus and production technique.
What is Actually Happening With The Prices of Plastics and Natural Gas?
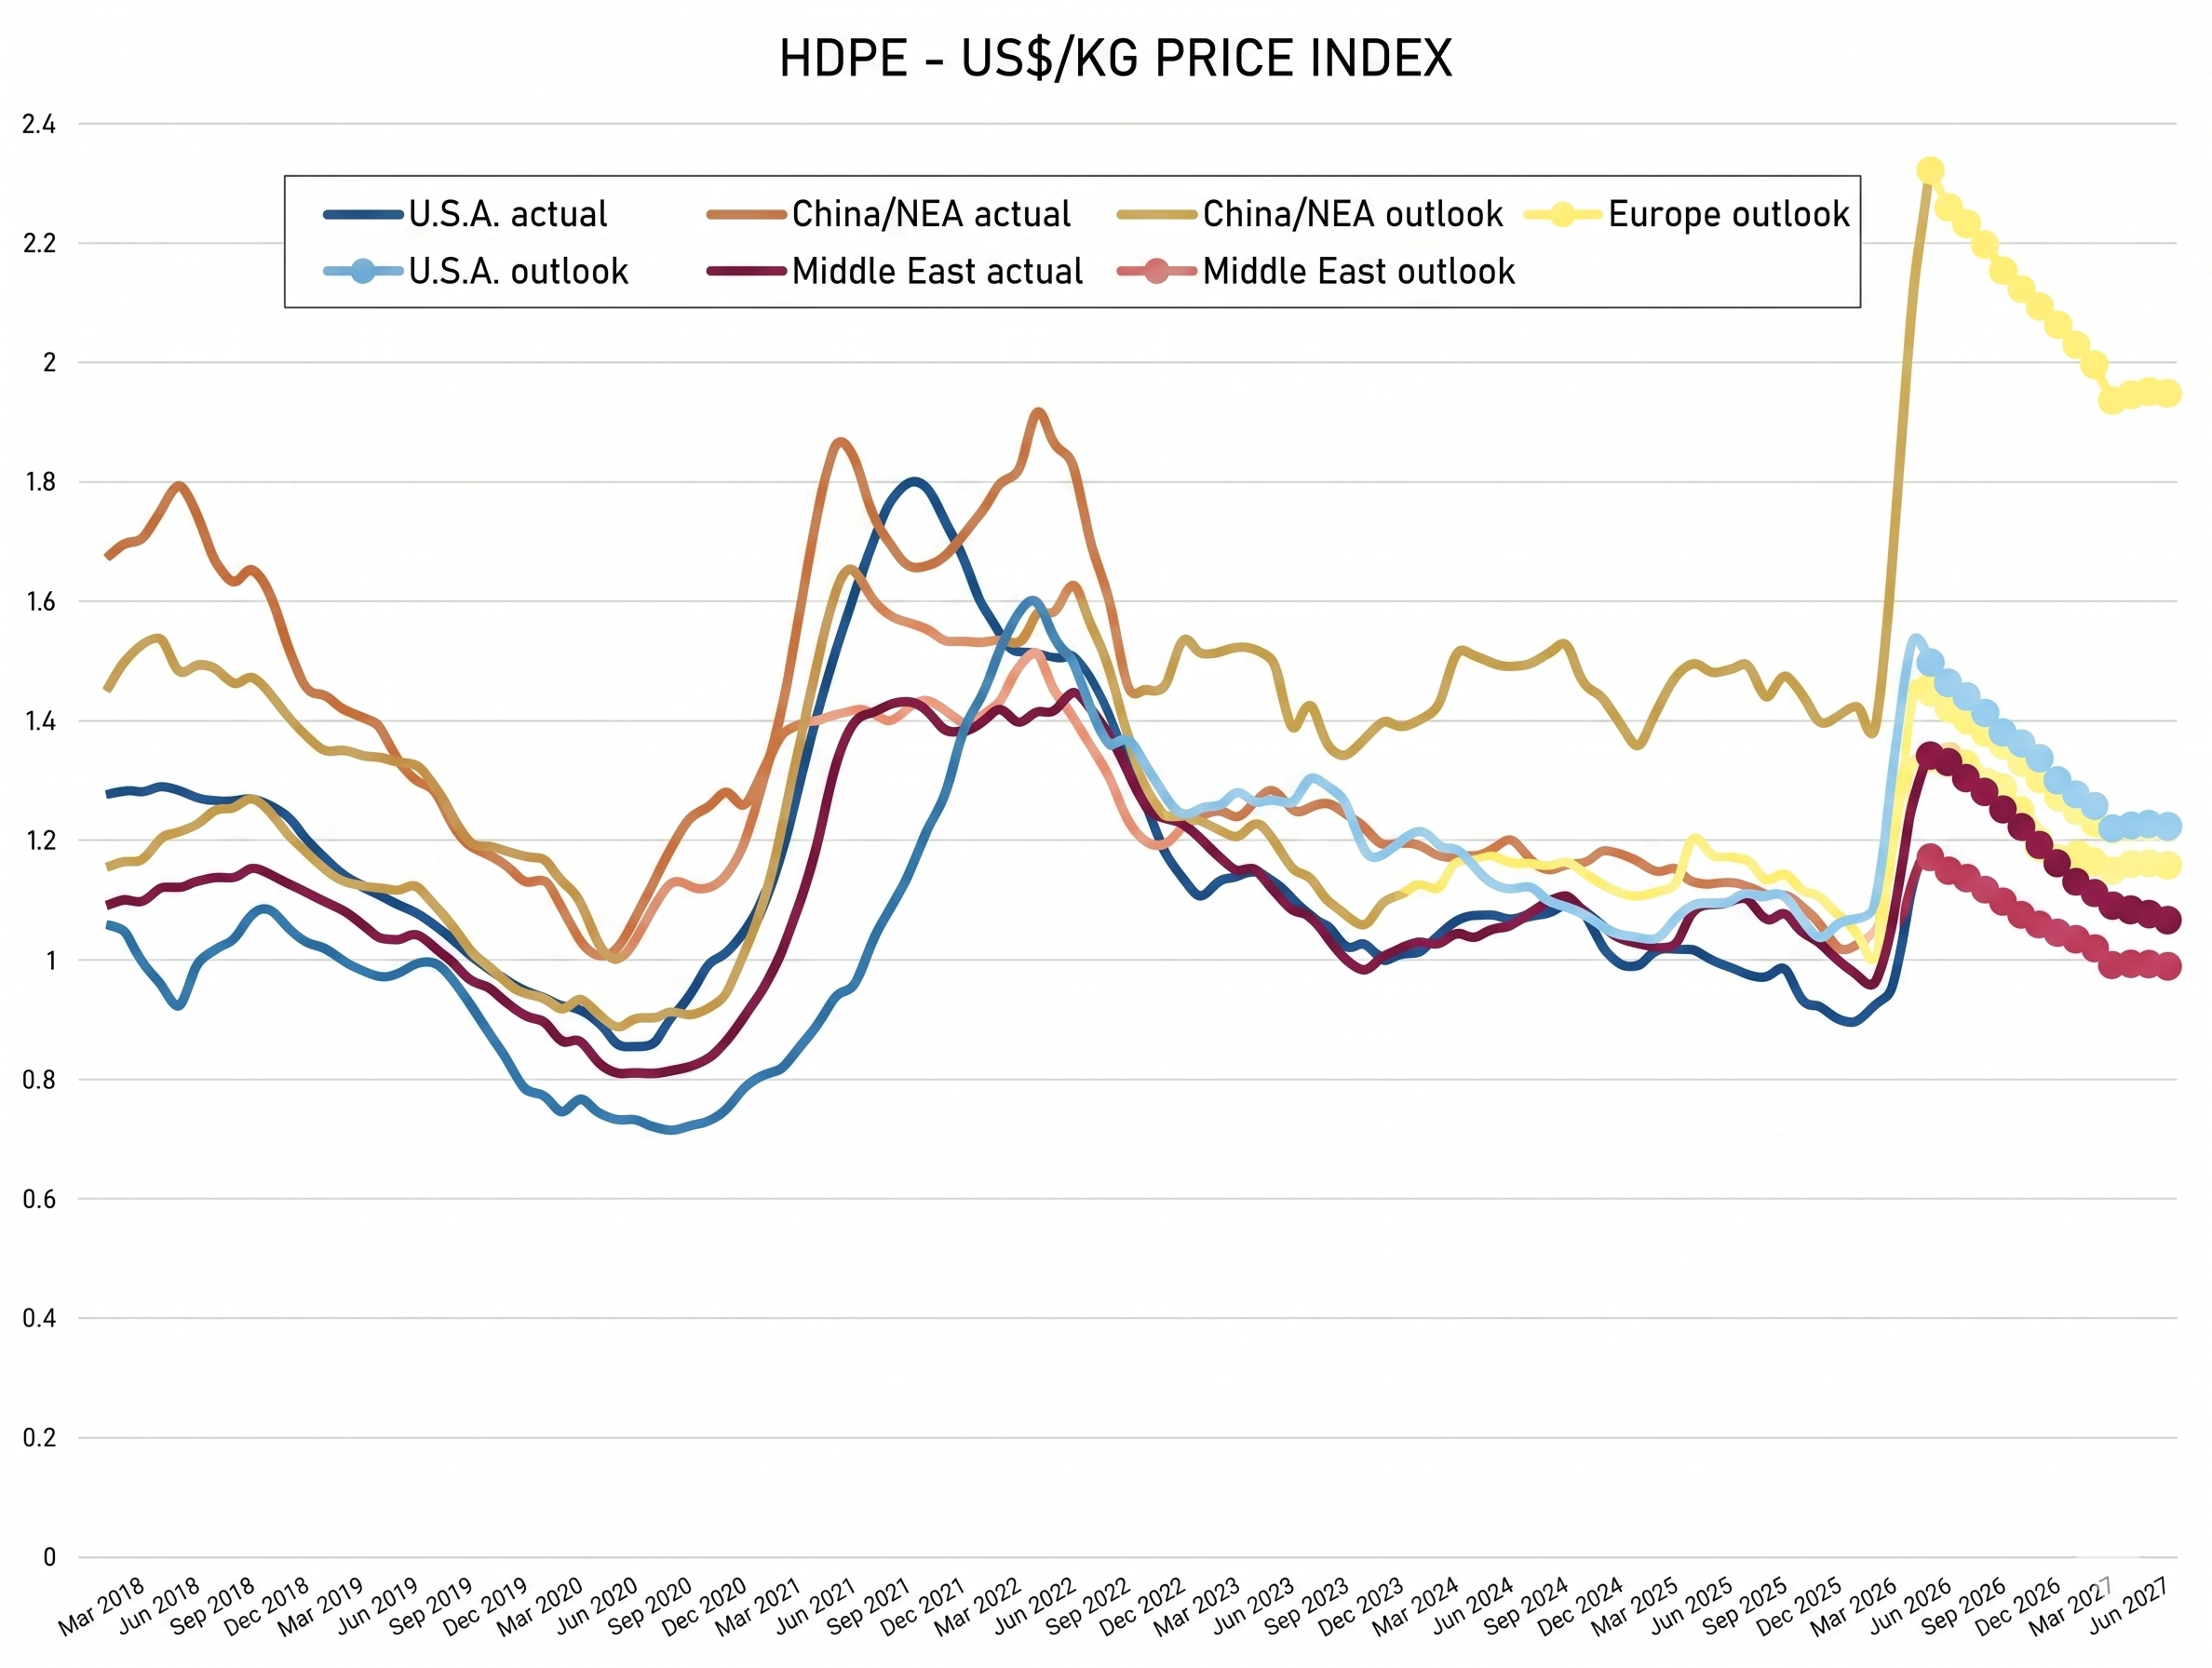
As indicated by data from Business AnalytiQ U.S. High Density Polyethylene prices have risen ~26% since early 2026 lows despite the theory of the U.S. market being fully insulated from global feedstock price shocks.
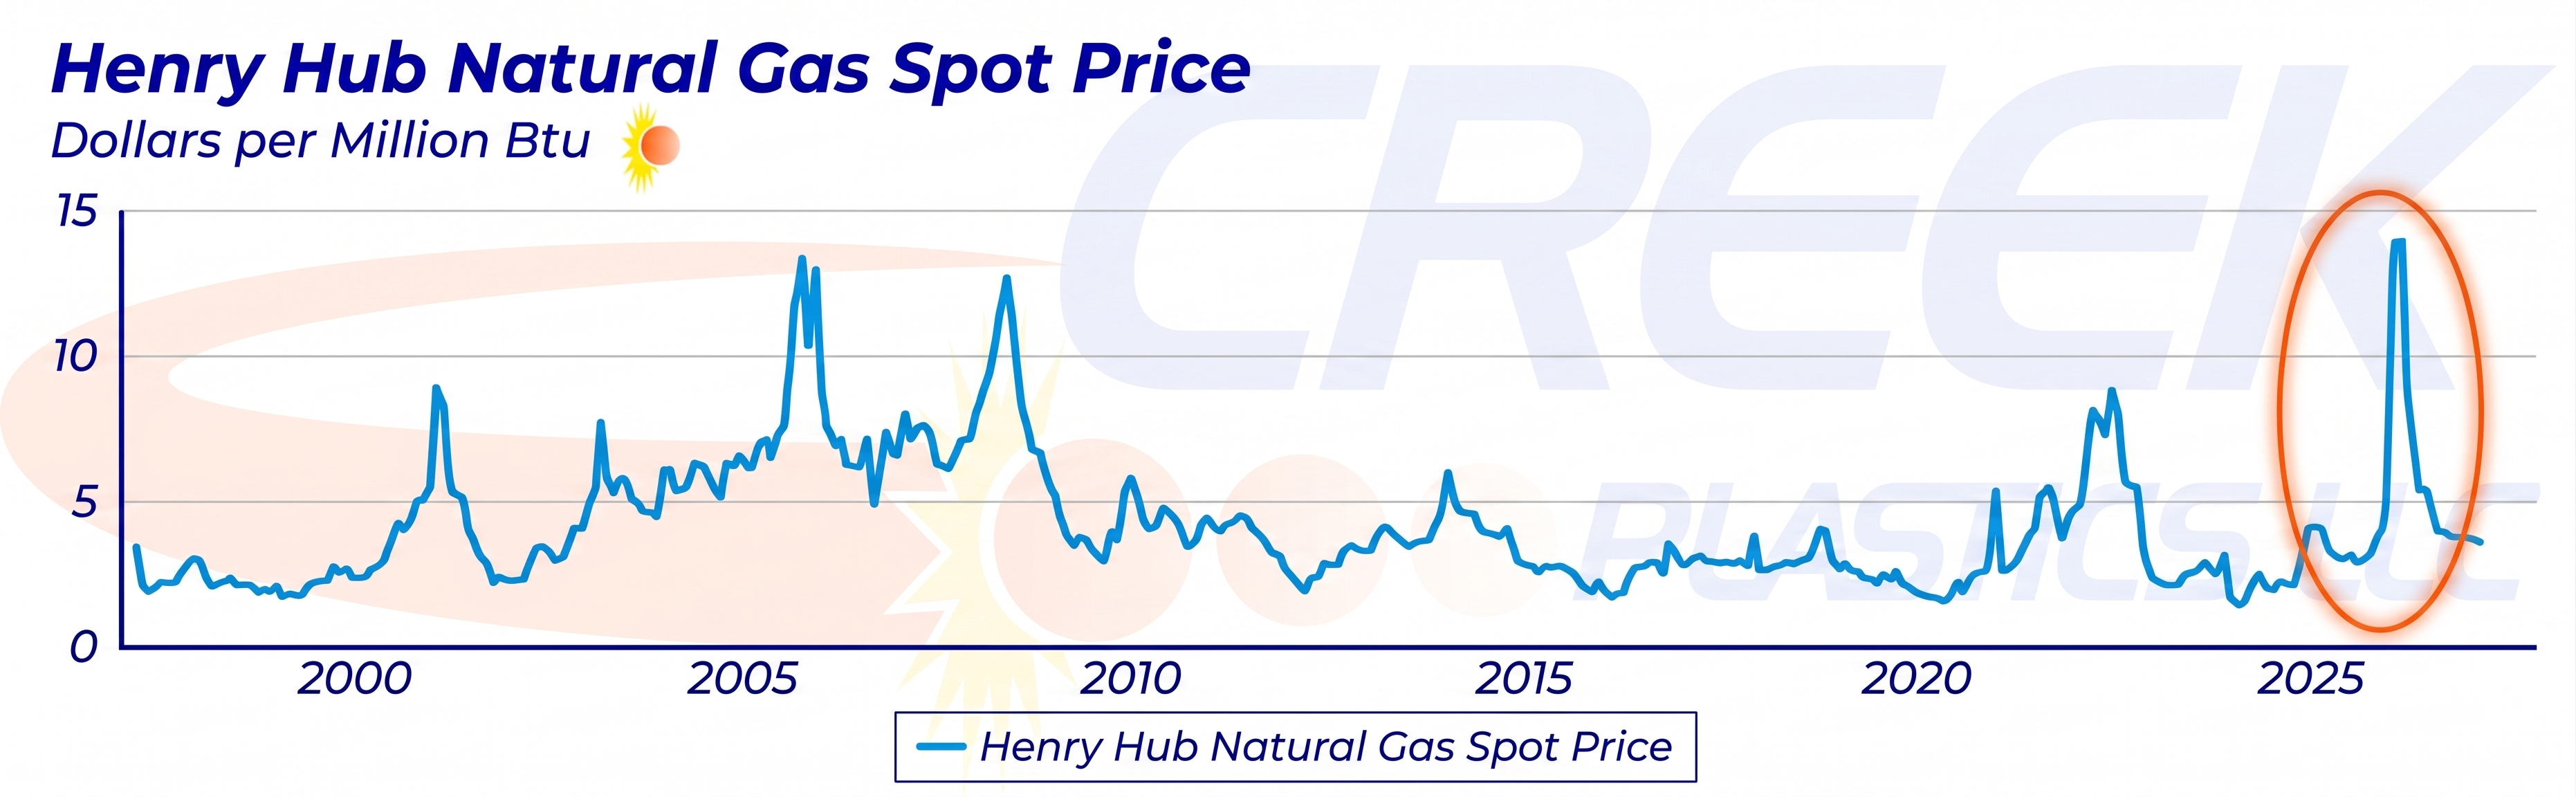
Looking comparatively at the historical price chart of U.S. natural gas from the Henry Hub benchmark and HDPE price index we see that plastics prices have risen significantly as a result of the Iran war compared to relatively unaffected natural gas prices which currently trade at ~ $2.77/MMBtu.
Natural gas prices are trending down from uncertainty driven highs at the beginning of the Iran conflict, while HDPE prices are still trending upwards. This is a notable disconnect that directly contradicts the fact that the U.S. market is structurally insulated due to the unique feedstock base the U.S. possesses.
Inferring from Exxon’s comments in their Q1 2026 Earnings Call, a possible driver in this disconnect could be increased bidding competition with foreign buyers for plastics. Foreign buyers have a higher willingness to pay as their production of plastics using an oil based feedstock is much more expensive than our cheap natural gas feedstock. As they look to our market to buy plastic, we are forced to compete with their bids. However, as of now export data from the U.S. Census Bureau, “USA Trade Online does not suggest any abnormal increase in plastics export value.
This chart shows the historical February to March Increase in plastics export value. Because the Iran conflict began in late February, we should see a much larger increase in exports if foreign buyers stepping in are the cause of domestic plastic price increases.
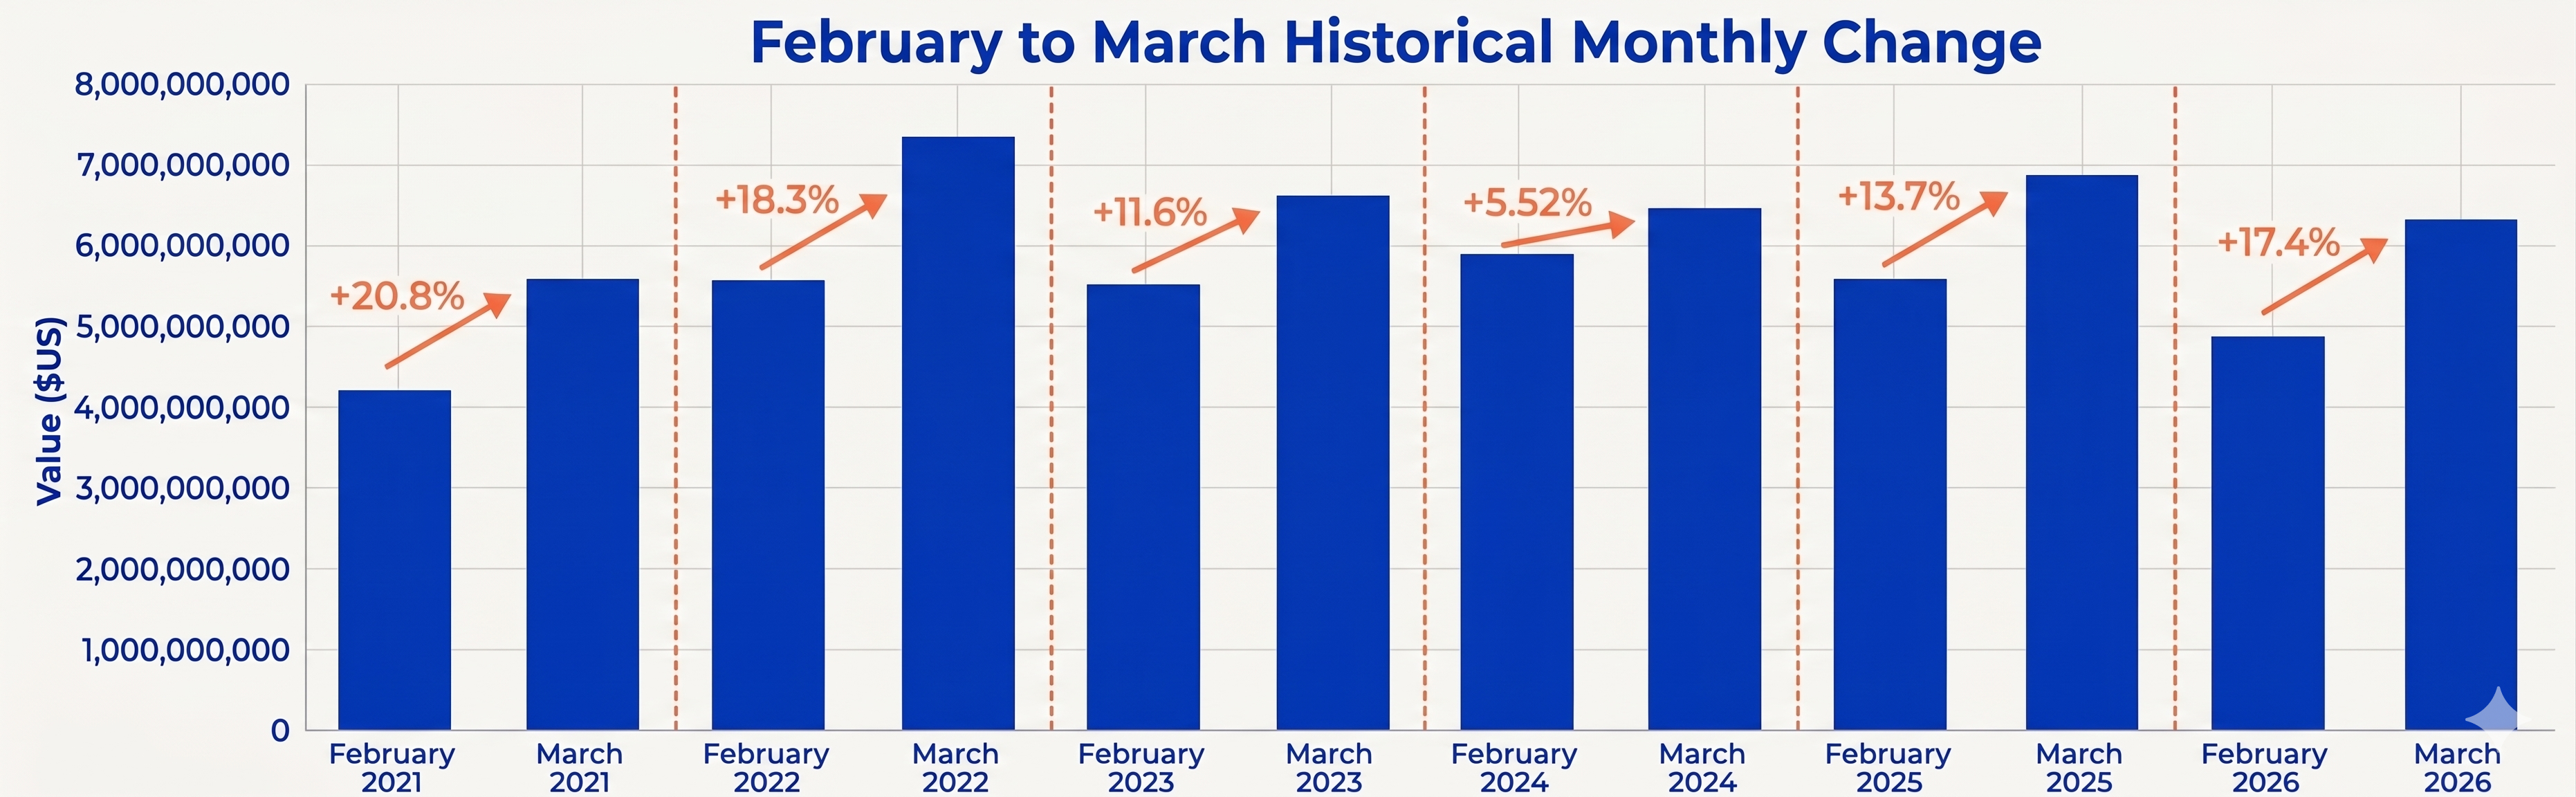
Export data may be lagging due to a slow export logistics process and the time required for real overseas demand to materialize. The April Figures will give a much clearer insight into what exactly is driving plastic prices up. On June 9-12, 2026, the Census Bureau will release the April export figures
Additionally, in mid July large plastics producers release their Q2 Earnings and current Q1 public company reports capture only a brief period after the Iran conflict began. Conclusions are difficult to draw from this incomplete data, and are subject to speculation. Creek regularly monitors public plastics industry companies’ earnings reports to provide insights into the market and facts with data to back it.
Creek Plastics will look forward to analyzing this future information as quick as possible to provide insights into what exactly is causing the domestic price increases beyond the simple answer of “the Strait of Hormuz shutting off supply”
We’re grateful for your trust and your partnership, and we’ll keep earning it every day.
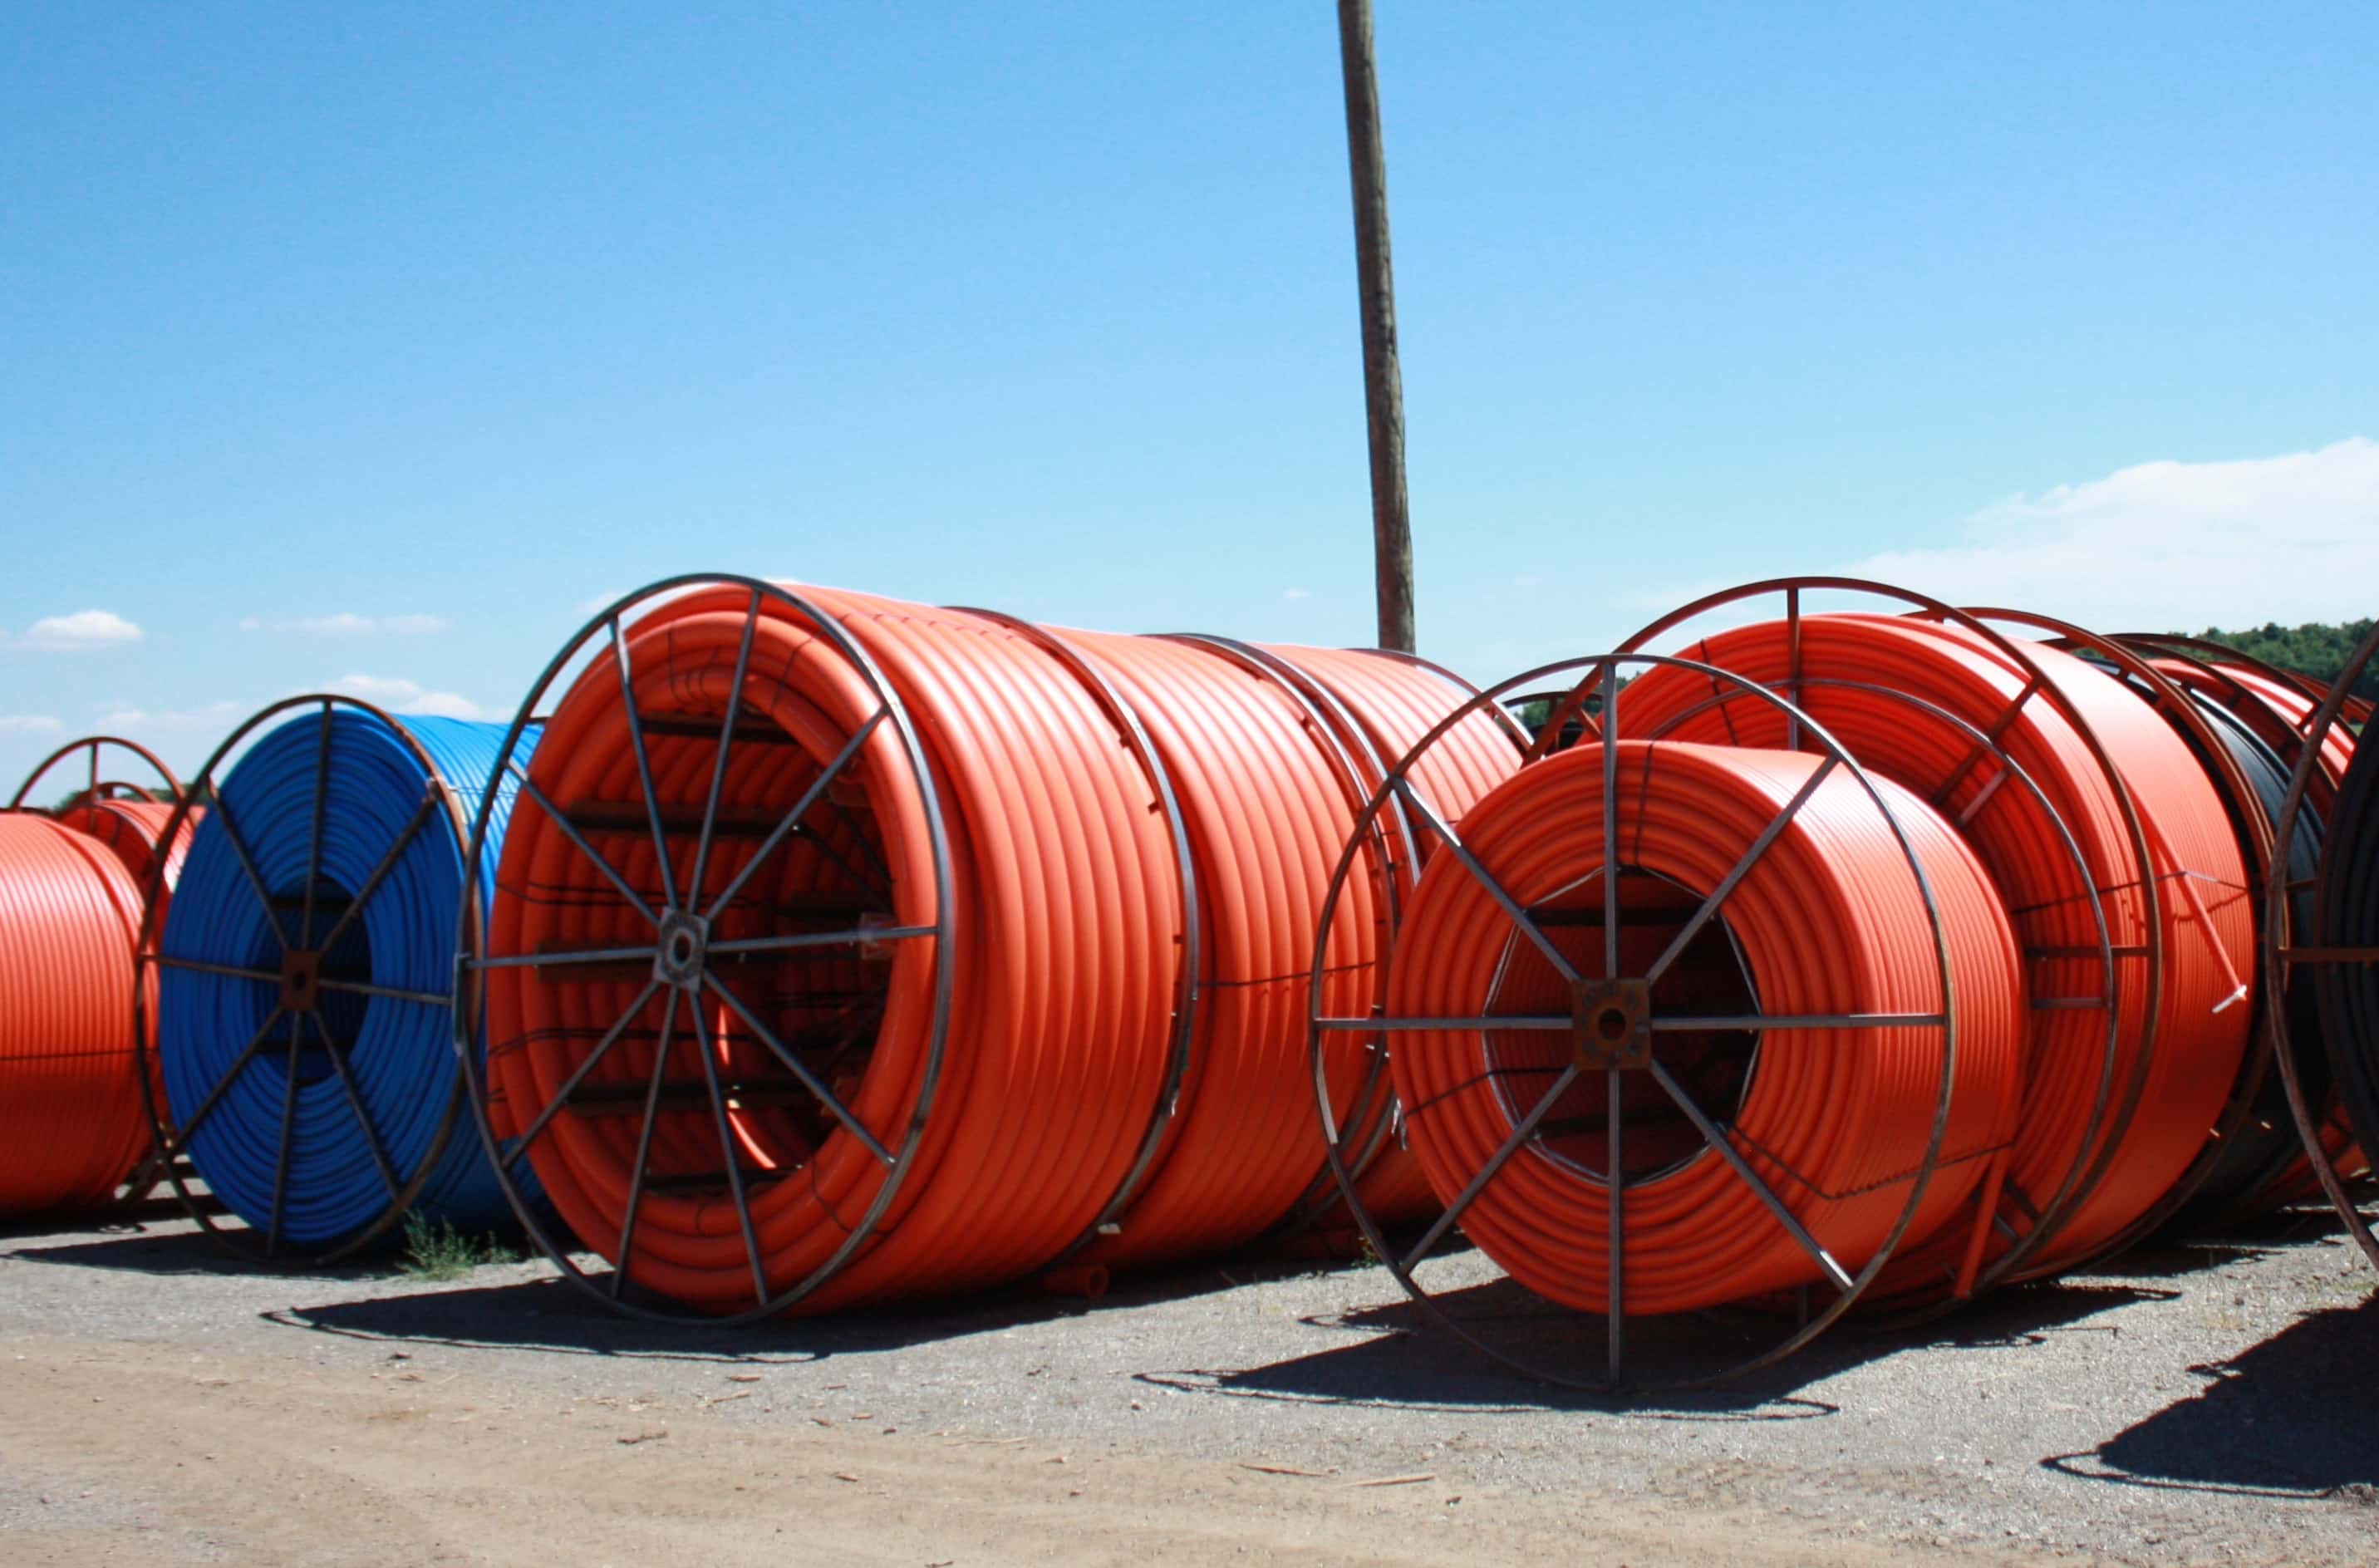
Need Reliable HDPE Conduit Supply? Creek Plastics manufactures high-quality, U.S.-made HDPE conduit for telecommunications, CATV, and electrical applications. Contact Creek Plastics today to discuss pricing, lead times, and product availability for your next project.
Disclaimer
This report is provided for informational purposes only and does not constitute business, financial, or purchasing advice. Creek Plastics assumes absolute zero liability for any direct, indirect, or consequential losses, damages, business decisions, or legal claims resulting from the use of or reliance on this material.
The market data, statistics, and industry insights presented herein are compiled and aggregated from external, third-party public sources. Creek Plastics claims no ownership, proprietary rights, or original authorship over this third-party information; all credit, intellectual property, and copyrights belong entirely to their respective original sources and authors. While this information is gathered from sources believed to be reliable, Creek Plastics makes no guarantees regarding its accuracy, completeness, or timeliness.
Furthermore, any quotes, statements, or commentary attributed to specific individuals, public figures, or corporate executives (including those from external companies) are derived from public records, earnings calls, or media reports and are provided “as-is.” Creek Plastics does not warrant the literal accuracy, completeness, or context of these third-party statements and explicitly disclaims any liability for inadvertent misquotes, transcription errors, or mischaracterizations.


